#define N 300
#define N1 10
#define N2 30
#define M 21
#include<math.h>
#include <chplot.h>
int main() {
array double y1[N], x[M], hist[M];
array double y2[N1][N2];
class CPlot plot;
linspace(x, -1, 1);
linspace(y1, 0, 2*M_PI);
linspace(y2, 0, 4*M_PI);
y1 = sin(y1);
y2 = sin(y2);
histogram(y1, x); // chplot.histogram
histogram(y2, x); // chplot.histogram
histogram(y1, x, hist);
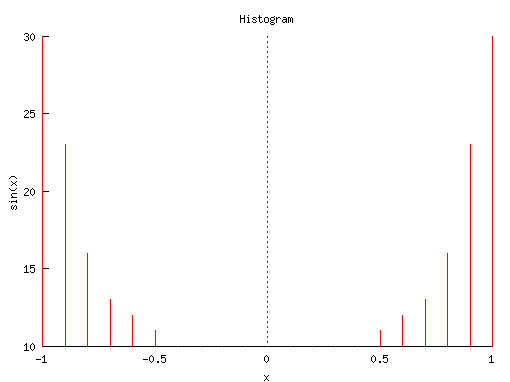
plotxy(x, hist, "Histogram", "x", "sin(x)", &plot);
plot.PlotType(PLOT_PLOTTYPE_IMPULSES, 0);
plot.Plotting();
printf("x hist = %f %f\n", x, hist);
histogram(y2, x, hist);
plotxy(x, hist, "Histogram", "x", "sin(x)", &plot);
plot.PlotType(PLOT_PLOTTYPE_IMPULSES, 0);
plot.Plotting();
printf("x hist = %f %f\n", x, hist);
}

 x hist = -1.000000 -0.900000 -0.800000 -0.700000 -0.600000 -0.500000 -0.400000 -0.300000
-0.200000 -0.100000 0.000000 0.100000 0.200000 0.300000 0.400000 0.500000 0.600000
0.700000 0.800000 0.900000 1.000000
30.000000 23.000000 16.000000 13.000000 12.000000 11.000000 10.000000 10.000000
10.000000 10.000000 10.000000 10.000000 10.000000 10.000000 10.000000 11.000000
12.000000 13.000000 16.000000 23.000000 30.000000
x hist = -1.000000 -0.900000 -0.800000 -0.700000 -0.600000 -0.500000 -0.400000 -0.300000
-0.200000 -0.100000 0.000000 0.100000 0.200000 0.300000 0.400000 0.500000 0.600000
0.700000 0.800000 0.900000 1.000000
30.000000 23.000000 16.000000 13.000000 12.000000 11.000000 10.000000 10.000000
10.000000 10.000000 10.000000 10.000000 10.000000 10.000000 10.000000 11.000000
12.000000 13.000000 16.000000 23.000000 30.000000

