#define N 300
#define N1 10
#define N2 30
#define M 21
#include <math.h>
#include <chplot.h>
int main() {
array double y1[N], x[M], hist[M];
array double y2[N1][N2];
class CPlot plot;
linspace(x, -1, 1);
linspace(y1, 0, 2*M_PI);
linspace(y2, 0, 4*M_PI);
y1 = sin(y1);
y2 = sin(y2);
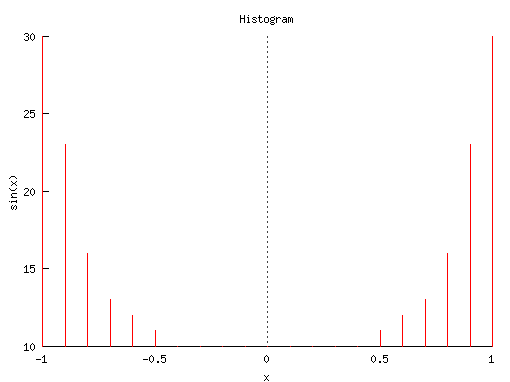
histogram(y1, x, hist);
plotxy(x, hist, "Histogram", "x", "sin(x)", &plot);
plot.PlotType(PLOT_PLOTTYPE_IMPULSES, 0);
plot.Plotting();
histogram(y2, x, hist);
plotxy(x, hist, "Histogram", "x", "sin(x)", &plot);
plot.PlotType(PLOT_PLOTTYPE_IMPULSES, 0);
plot.Plotting();
}


