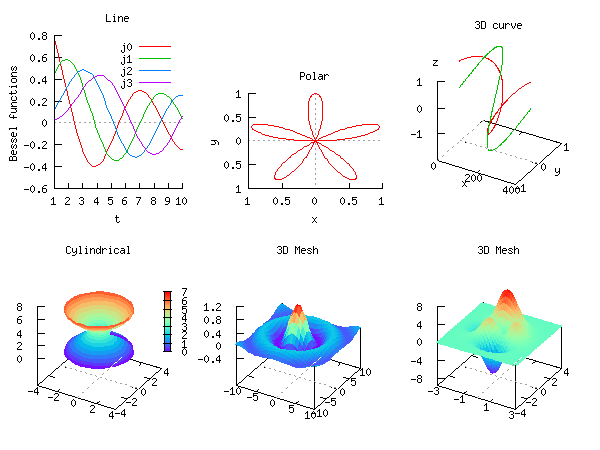
#include <chplot.h>
#include <math.h>

#define NVAR 4
#define POINTS 50
int main() {
    void derivs(double t, double y[], double dydt[]) {
      dydt[0] = -y[1];
      dydt[1]=y[0]-(1.0/t)*y[1];
      dydt[2]=y[1]-(2.0/t)*y[2];
      dydt[3]=y[2]-(3.0/t)*y[3];
    }

    double t0=1, tf=10, y0[NVAR];
    double t[POINTS], y1[NVAR][POINTS];
    int  points;
    int  datasetnum=0, line_type=4, line_width = 2;
    array double theta2[360], r2[360];
    array double x3[360], y3[360], z3[2][360];
    double theta4[36], z4[20], r4[720];
    double r, x5[30], y5[30], z5[900];
    double x6[40], y6[60], z6[2400];


    int i, j;
    class CPlot subplot, *spl;

    /* plot 1 */
    y0[0]=j0(t0);
    y0[1]=j1(t0);
    y0[2]=jn(2,t0);
    y0[3]=jn(3,t0);
    points = odesolve(t, y1, derivs, t0, tf, y0);


    /* plot 2 */
    linspace(theta2, 0, M_PI);
    r2 = sin(5*theta2);

    /* plot 3 */
    linspace(x3, 0, 360);
    y3 = sin(x3*M_PI/180);
    for(i=0; i<360; i++) {
        z3[0][i] = cos(x3[i]*M_PI/180);
        z3[1][i] = y3[i];
    }

    /* plot 4 */
    linspace(theta4, 0, 360);
    linspace(z4, 0, 2*M_PI);
    for(i=0; i<36; i++) {
        for(j=0; j<20; j++) {
            r4[i*20+j] = 2+cos(z4[j]);
        }
    }

    /* plot 5 */
    linspace(x5, -10, 10);
    linspace(y5, -10, 10);
    for(i=0; i<30; i++) {
        for(j=0; j<30; j++) {
            r = sqrt(x5[i]*x5[i]+y5[j]*y5[j]);
            z5[30*i+j] = sin(r)/r;
        }
    }

    /* plot 6 */
    linspace(x6, -3, 3);
    linspace(y6, -4, 4);
    for(i=0; i<40; i++) {
        for(j=0; j<60; j++) {
            z6[60*i+j] = 3*(1-x6[i])*(1-x6[i])*
                         exp(-(x6[i]*x6[i])-(y6[j]+1)*(y6[j]+1))
            - 10*(x6[i]/5 - x6[i]*x6[i]*x6[i]-pow(y6[j],5))*
                         exp(-x6[i]*x6[i]-y6[j]*y6[j])
            - 1/3*exp(-(x6[i]+1)*(x6[i]+1)-y6[j]*y6[j]);
        }
    }

    subplot.subplot(2,3);               /* create 2 x 3 subplot */
    spl = subplot.getSubplot(0,0);      /* get subplot (0,0) */
    spl->title("Line");
    spl->label(PLOT_AXIS_X,"t");
    spl->label(PLOT_AXIS_Y,"Bessel functions");
    spl->data2D(t, y1);
    spl->legend("j0", 0);
    spl->legend("j1", 1);
    spl->legend("j2", 2);
    spl->legend("j3", 3);

    spl = subplot.getSubplot(0,1);      /* get subplot (0,1) */
    spl->title("Polar");
    spl->axisRange(PLOT_AXIS_XY, -1, 1, .5);
    spl->data2D(theta2, r2);
    spl->polarPlot(PLOT_ANGLE_RAD);
    spl->sizeRatio(-1);

    spl = subplot.getSubplot(0,2);      /* get subplot (0,2) */
    spl->title("3D curve");
    spl->data3D(x3, y3, z3);
    spl->axisRange(PLOT_AXIS_X, 0, 400, 200);
    spl->axisRange(PLOT_AXIS_Y, -1, 1, 1);
    spl->axisRange(PLOT_AXIS_Z, -1, 1, 1);

    spl = subplot.getSubplot(1,0);      /* get subplot (1,0) */
    spl->title("Cylindrical");
    spl->data3D(theta4, z4, r4);
    spl->coordSystem(PLOT_COORD_CYLINDRICAL, PLOT_ANGLE_DEG);
    spl->axisRange(PLOT_AXIS_Z, 0, 8, 2);
    spl->axisRange(PLOT_AXIS_XY, -4, 4, 2);
    spl->label(PLOT_AXIS_XYZ, NULL);

    spl = subplot.getSubplot(1,1);      /* get subplot (1,1) */
    spl->title("3D Mesh");
    spl->axisRange(PLOT_AXIS_X, -10, 10, 5);
    spl->axisRange(PLOT_AXIS_Y, -10, 10, 5);
    spl->axisRange(PLOT_AXIS_Z, -.4, 1.2, .4);
    spl->data3D(x5, y5, z5);
    spl->colorBox(PLOT_OFF);
    spl->label(PLOT_AXIS_XYZ, NULL);

    spl = subplot.getSubplot(1,2);      /* get subplot (1,2) */
    spl->title("3D Mesh");
    spl->data3D(x6, y6, z6);
    spl->axisRange(PLOT_AXIS_X, -3, 3, 2);
    spl->axisRange(PLOT_AXIS_Y, -4, 4, 2);
    spl->axisRange(PLOT_AXIS_Z, -8, 8, 4);
    spl->colorBox(PLOT_OFF);
    spl->label(PLOT_AXIS_XYZ, NULL);
    spl->ticsLevel(0.1);
    subplot.plotting();
}
