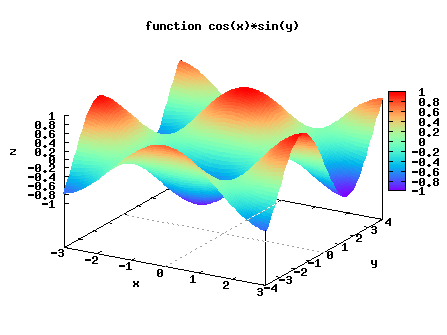
 /* The source code for generating the above plot for function f(x,y) = cos(x)sin(x) */
#include <math.h>
#include <chplot.h>
/* functon f(x,y) = cos(x)sin(x) to be plotted */
double func(double x, double y) {
return cos(x)*sin(y);
}
int main() {
double x0 = -3, // minimum value for x
xf = -3, // minimum value for x
y0 = -4, // minimum value for y
yf = -4; // minimum value for y
int numx = 80, // number of points for x
numy = 100; // number of points for y
fplotxyz(func, x0, xf, y0, yf, numx, numy,
"function cos(x)*sin(y)", "x", "y", "z"); // title and labels
}
/* The source code for generating the above plot for function f(x,y) = cos(x)sin(x) */
#include <math.h>
#include <chplot.h>
/* functon f(x,y) = cos(x)sin(x) to be plotted */
double func(double x, double y) {
return cos(x)*sin(y);
}
int main() {
double x0 = -3, // minimum value for x
xf = -3, // minimum value for x
y0 = -4, // minimum value for y
yf = -4; // minimum value for y
int numx = 80, // number of points for x
numy = 100; // number of points for y
fplotxyz(func, x0, xf, y0, yf, numx, numy,
"function cos(x)*sin(y)", "x", "y", "z"); // title and labels
}
|
|