Real-Time Plotting Mathematical Expressions
with Graphical User Interface in Windows
Introduction
A sample interactively
real-time plotting with continuous data in Windows.
The example is shown by mathematical expressions with different amplitude
with graphical user interface (GUI).
You may modify your code your C or C++ program to use two threads.
One for incoming data, and other for plotting.
When you have a set of data, one thread uses SIGL
to plot and convert the data to be diaplayed inside your GUI.
When you have new or updated data set,
you use SIGL to replot and display the updated plot
inside the same window of your GUI.
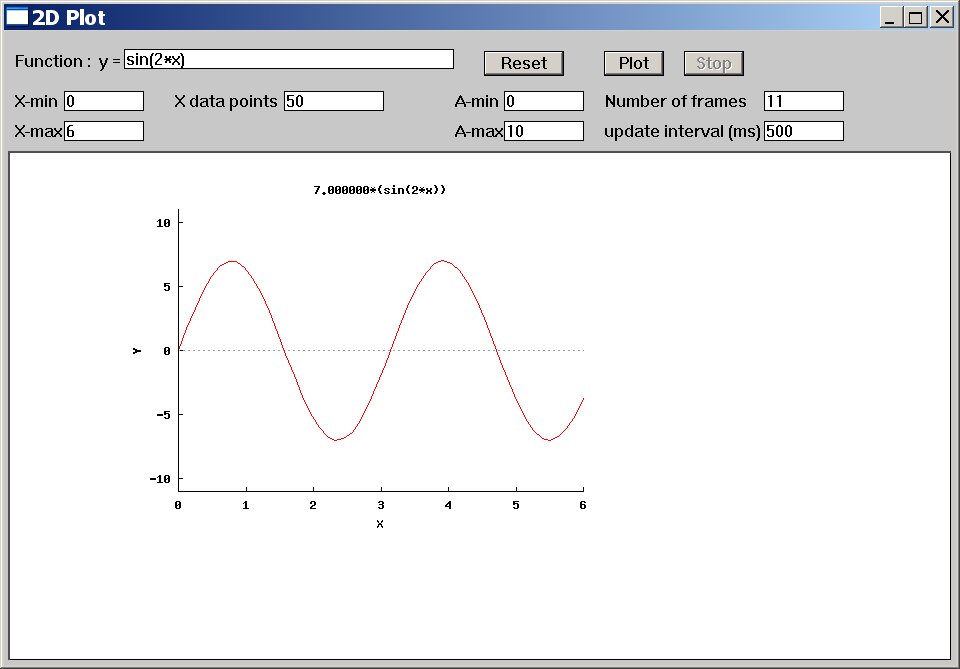
The above interactive plotting can be done
using Ch Professional, Student, or Evaluation Edution for Windows. Click the above
image to get an enlarged one.
The above GUI for interactive plotting is accomplished by the program winplotanim.ch,
which is included in the distribution of the sample code below.
To compile the program in C++,
SIGL C++ graphical library is needed for plotting and Embedded Ch is needed to process
the mathematical expressions entered by the user through the GUI.
System Requiement
-
Windows 95/98/Me/NT/2000/XP/2003/Vista.
-
The program winplotanim.ch can readily run in
Ch Professonal, Student, or Evaluation Edition.
The program winplotanim.cpp can be compiled using a C++ compiler with
SIGL and
Embedded Ch.
Download the Code
Click here to download the code that generates the above GUI for plotting.
|