|
Plotting in Ch/C++
SoftIntegration provides the simplest possible solution for two and three dimensional graphical plottings within the framework of C/C++. Graphical plottings in Ch Professional Edition and SoftIntegration C++ Graphical Library (SIGL) are based on bindings to Gnuplot. Two and three dimensional graphical plots can be very easy to run in Ch or compiled in C++. All SIGL code can run in Ch without modification. Plots in Ch can be generated from data arrays or files, and can be displayed on a screen, saved as an image file in different file formats, or output to the stdout stream in a proper image format for display in a Web browser through a Web server. The list of supported file formats can be found here. High-level plotting function files such as plotxy(), plotxyz(), plotxyf(), plotxyzf() are very convenient to use. For example, the program
    #include <math.h>
    #include <chplot.h>
    int main() {
        int numpoints = 36;
        array double x[numpoints], y[numpoints];

        lindata(0, 360, x, 36); // assign x with values from 0 to 360 linearly
        y = sin(x*M_PI/180);
        plotxy(x, y, "Ch plot", "xlabel", "ylabel");
    }
can plot a sine wave as shown below.
The above plot can also be generated interactively by the following commands in a Ch shell.
If the data for the above sine wave have already been generated and saved in
a file
called "sinewave.dat"
with two columns, one for x-coordinate and the other for
y-coordinate for each point of the curve, then the plot can be
generated by the following statement either typed in a
command shell or a program.
plotxyf("sinwave.dat", "Ch plot", "xlabel", "ylabel");
The plotting class CPlot enables high-level creation and manipulation of plots within the Ch language environment. To export the above plot in Postscript and PNG files named demo.eps and demo.png, respectively, the following program can be used.
    #include <math.h>
    #include <chplot.h>
    int main() {
        int numpoints = 36;
        array double x[numpoints], y[numpoints];
        class CPlot plot;

        lindata(0, 360, x, 36);
        y = sin(x*M_PI/180);
        plotxy(x, y, "Ch plot", "xlabel", "ylabel", &plot);

        /* create a postscript file */
        plot.outputType(PLOT_OUTPUTTYPE_FILE, "postscript eps", "demo.eps");
        plot.plotting();

        /* create a png file */
        plot.outputType(PLOT_OUTPUTTYPE_FILE, "png color", "demo.png");
        plot.plotting();
    }
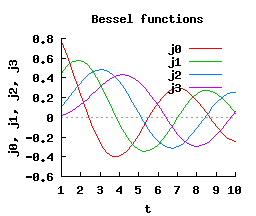
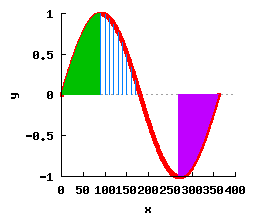
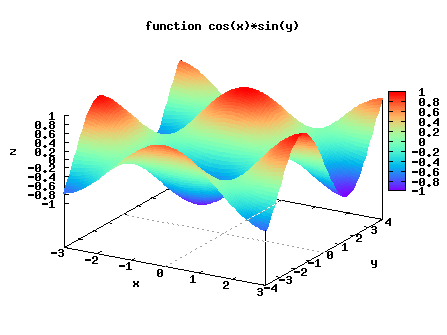
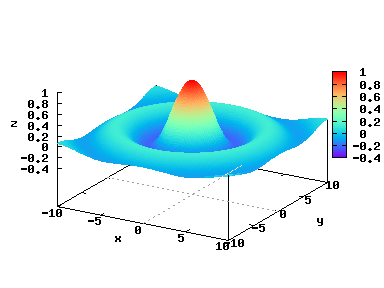
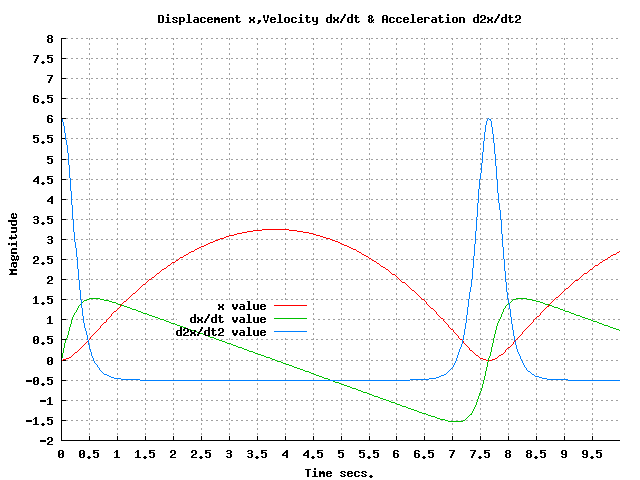
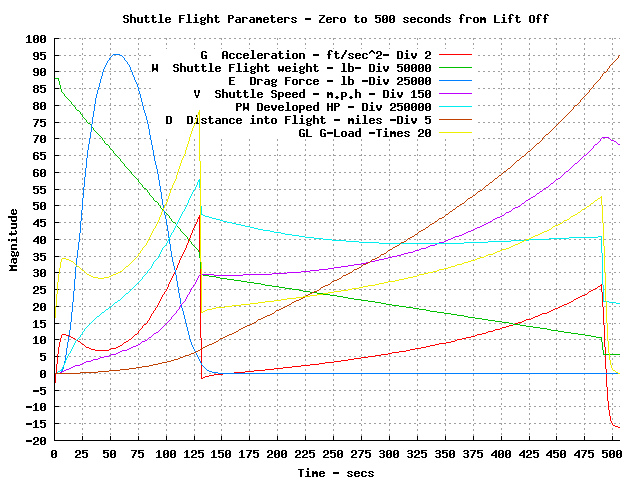
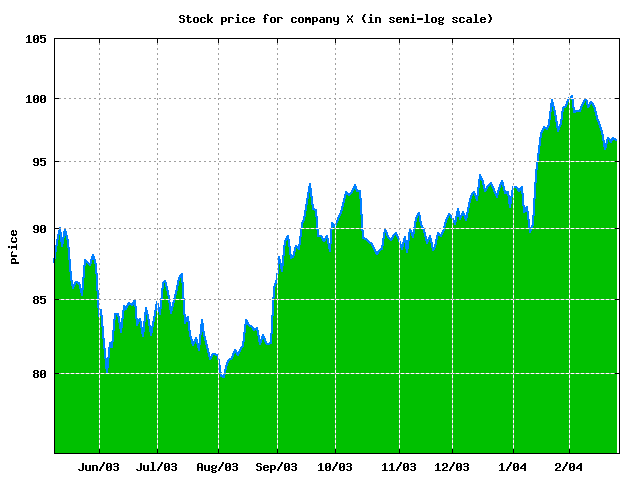
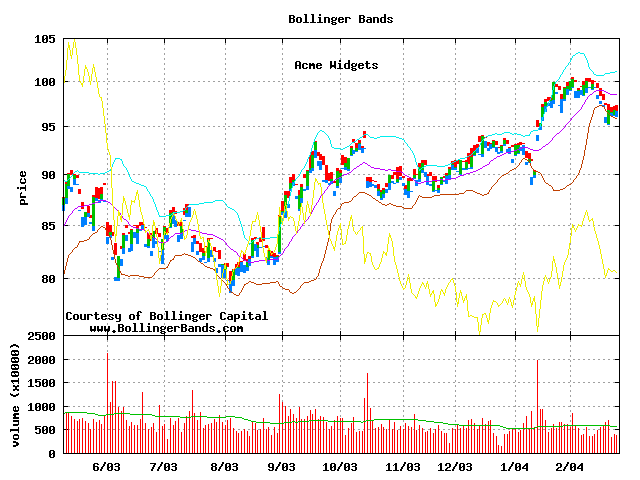
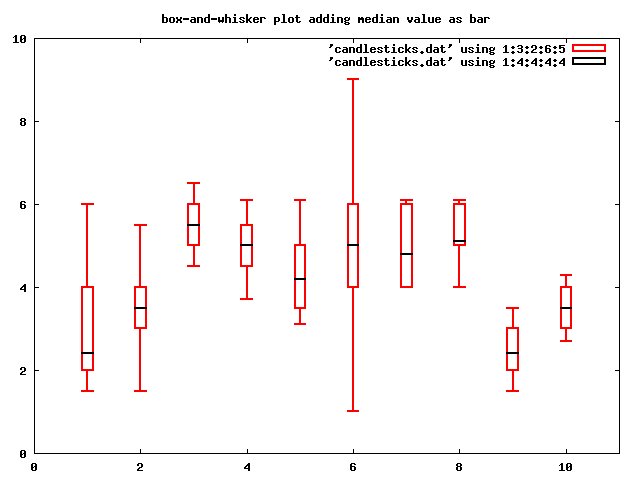
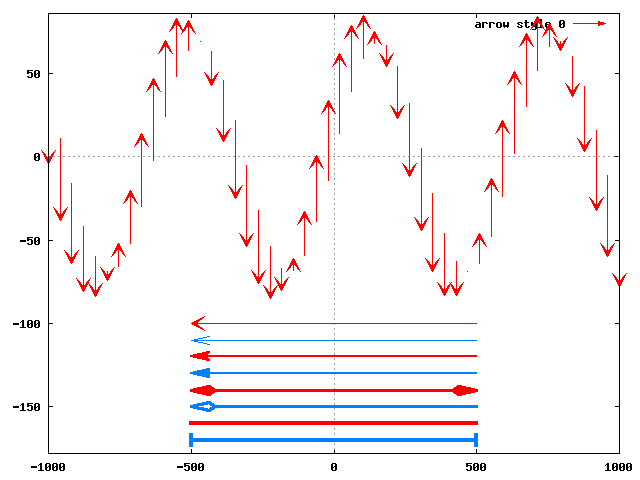
Details about Ch plotting are described in the Ch User's Guide and Ch Reference Guide. Using Ch plotting features, interactive plotting can be generated dynamically on-line. Winplot is an example of how interactive plotting can be accomplished in Ch with mathematical expressions entered by the user through a graphical user interface in Windows. Winplotanim is an example of how real-time data can be interactively plotted in Ch with mathematical expressions entered by the user through a graphical user interface in Windows. More additional demos can be found here. Click a plot image below to view the corresponding Ch/C++ program that generates the plot readily for display through the Web.
|